The book for today is The Data Warehouse Toolkit by Ralph Kimball. So for this one I am only going to keep notes for the first two chapters for now.
Overview
- First and foremost the DW/BI system must consider the needs of the business.
- With business needs firmly in hand, we work backwards through the logical and then physical designs along with decisions about technology and tools.
Different worlds of Data Capture and Data Analysis
One of the most important assets of any organization is its information. This asset is used for 2 purposes :
- Operational record keeping
- Analytical decision making
Operational systems are where you put the data in.
DW/BI system is where you get the data out.
- Operational systems are optimized to process transactions quickly and typically don’t maintain history but rather update data to reflect the most current state
- DW/BI systems are optimized for high-performance queries and typically demand that historical context be preserved to accurately evaluate the organization’s performance over time
Goals of Data Warehousing and Business Intelligence
DW/BI system must make information easily accessible : Contents must be understandable and the data intuitive and obvious to the business user. Simple and fast
- DW/BI system must present information consistently : The data must be credible. Carefully assembled, cleansed, quality assured and released only when fit for user consumption
- DW/BI system must adapt to change : designed to handle inevitable change gracefully so that existing data and application are not disrupted
- DW/BI must present information in timely way
- DW/BI must be secure bastion that protects information
- DW/BI system must serve as the authoritative and trustworthy foundation for improved decision making : DW must have the right data to support decision making.
■ Dimensional Modeling Introduction
Dimensional modeling is widely accepted as the preferred technique for presenting analytic data because it addresses two simultaneous requirements:
■ Deliver data that’s understandable to the business users.
■ Deliver fast query performance.
3NF and Dimensional Modeling
- Dimensional modeling makes databases simple
- Dimensional models are different from normal form 3NF models which seek to remove data redundancies
- Normalized 3NF structures divide data into many discrete entities, each of which becomes a relational table.
- 3NF models are sometimes referred as ER models. ER diagrams communicate relationship between tables
- Both 3NF and dimensional models can be represented in ERDs because both consist of joined relational tables; the key difference between 3NF and dimensional models is the degree of normalization.
- Normalized 3NF structures are immensely useful in operational processing because an update or insert transaction touches the database in only one place.
- Normalized models, however, are too complicated for BI queries
- most RDBMS can’t efficiently query a normalized model; the complexity of users’ unpredictable queries overwhelms the database optimizers, resulting in disastrous query performance.
- Dimensional modeling addresses the problem of overly complex schemas in the presentation area
A dimensional model contains the same information as a normalized model, but packages the data in a format that delivers user understandability, query performance, and resilience to change.
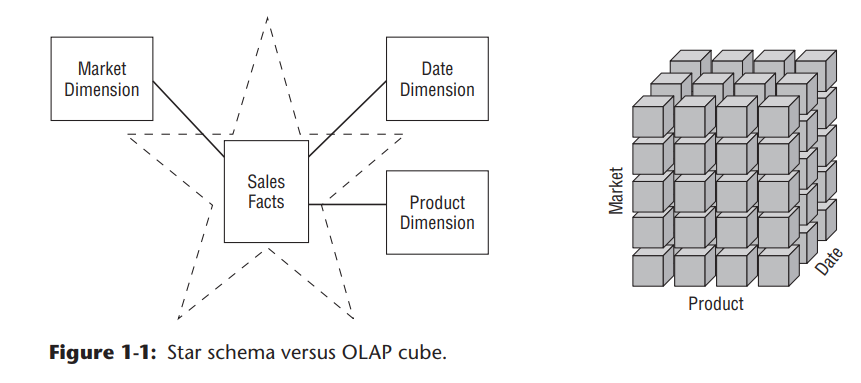
Star Schemas versus OLAP Cubes
- If your DW/BI environment includes either star schemas or OLAP cubes it leverages dimensional concepts.
- Both stars and cubes have a common logical design with recognizable dimensions however the implementation differs.
OLAP
- Data loaded into OLAP cube is stored and indexed using techniques designed for dimensional data.
- Performance aggregations/ precalculated summary tables often created and managed by OLAP cube engine.
- Cubes deliver superior query performance because of the precalculations, indexing strategies and other optimizations.
- Downside being we pay a load performance price for these capabilities especially with large data sets.
- OLAP cubes provide more analytically robust functions that exceed those available with SQL.
- Although capabilities of OLAP cubes are continuously improving, it is recommended that detailed, atomic information be loaded into a star schema, optional OLAP cubes are then populated from star schema.
Fact Tables for Measurements
The term fact represents a business measure.
Each row in a fact table corresponds to a measurement event. The data on each row is at a specific level of detail referred as the grain such as one row per product sold on a sales transaction.
- The most useful facts are numeric and additive such as dollars sales amount.
- Additivity is crucial as BI applications rarely retrieve a single fact table row, rather they bring 100’s, thousands or millions of fact table rows. And the most useful thing to do with these rows is add them up.
- Facts are sometimes semi-additive or non-additive.
- Semi additive facts such as account balances can’t be summed across the time dimension
- Non-additive facts such as unit prices can never be added